Australia is considered a good place to live globally, and a combination of stable government, climate, space, and relative tolerance puts it near the top of many lists of desirable abodes. But when it comes to material wealth, just how do we rank? Data journalist Juliette O’Brien delves into wealth distribution in this country and reveals who actually has all the money.
This story was featured in Issue 15 of Forbes Autralia. Tap here to secure your copy.
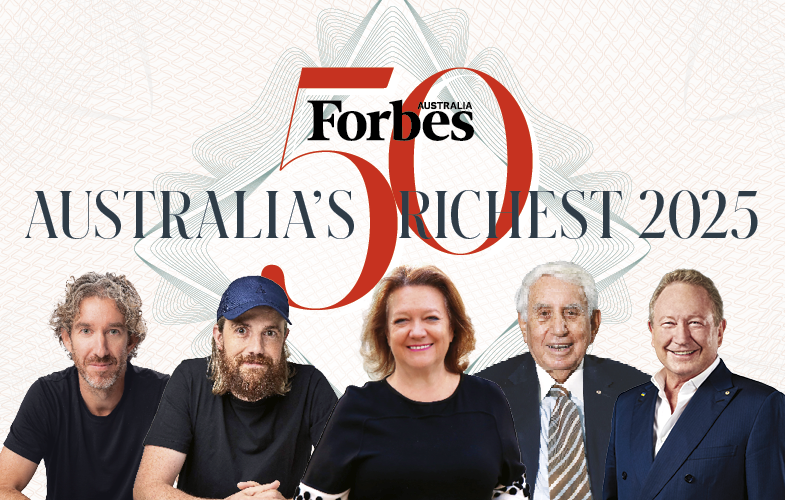
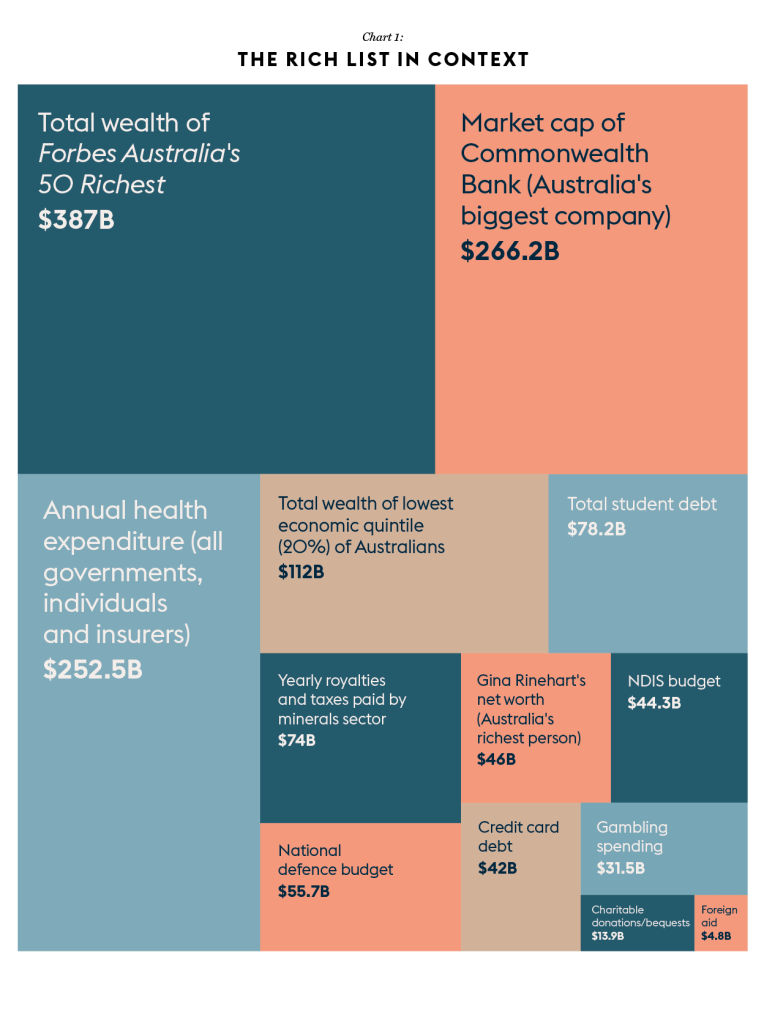
Australia’s 50 richest people have a combined wealth of $387 billion (AUD).
For context, that could pay off all Australian student and credit card debt three times over. Their wealth also matches the total wealth of the lowest economic quintile – roughly 2 million Australian households (Chart 1).
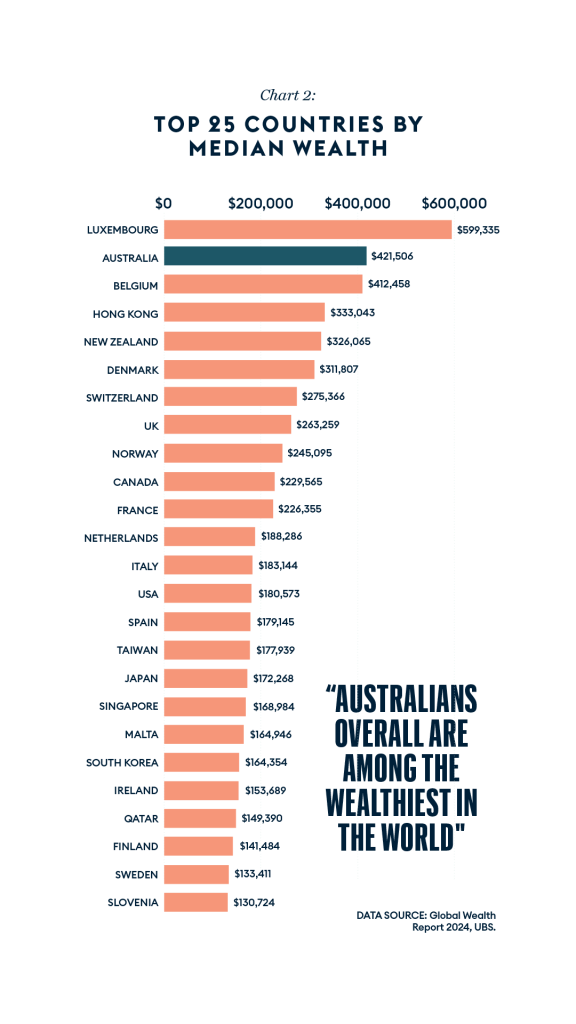
Yet, when looking at overall wealth, Australians are among the richest in the world.
According to the UBS Global Wealth Report 2024, Australians had a median wealth of $421,506 in 2023, making them the second richest globally. Only Luxembourg, a tiny country with an inordinate number of bankers and billionaires, ranks higher. (Chart 2).
Where is all this wealth?
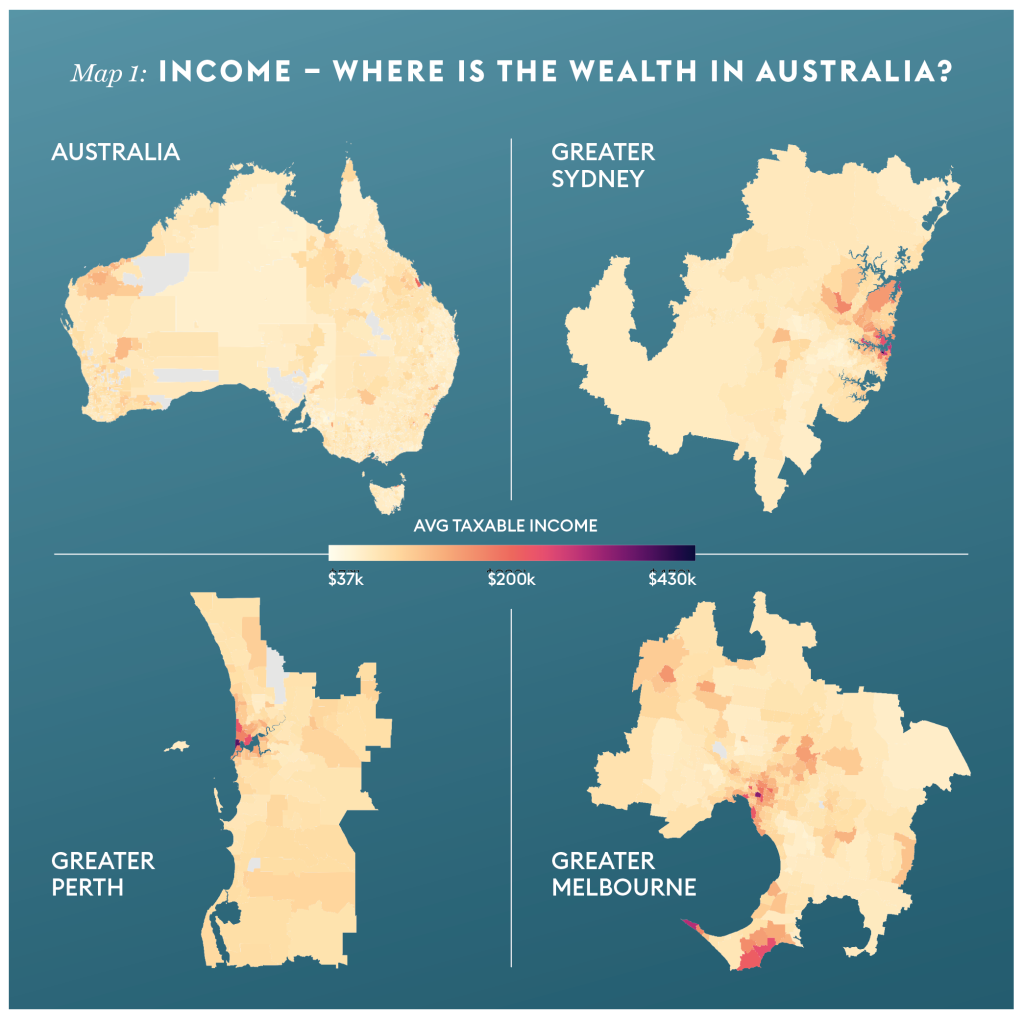
True wealth is often hidden (which makes the Forbes Rich List an investigative feat). But taxable incomes, released by the Australian Taxation Office (ATO), offer a glimpse. (Map 1).
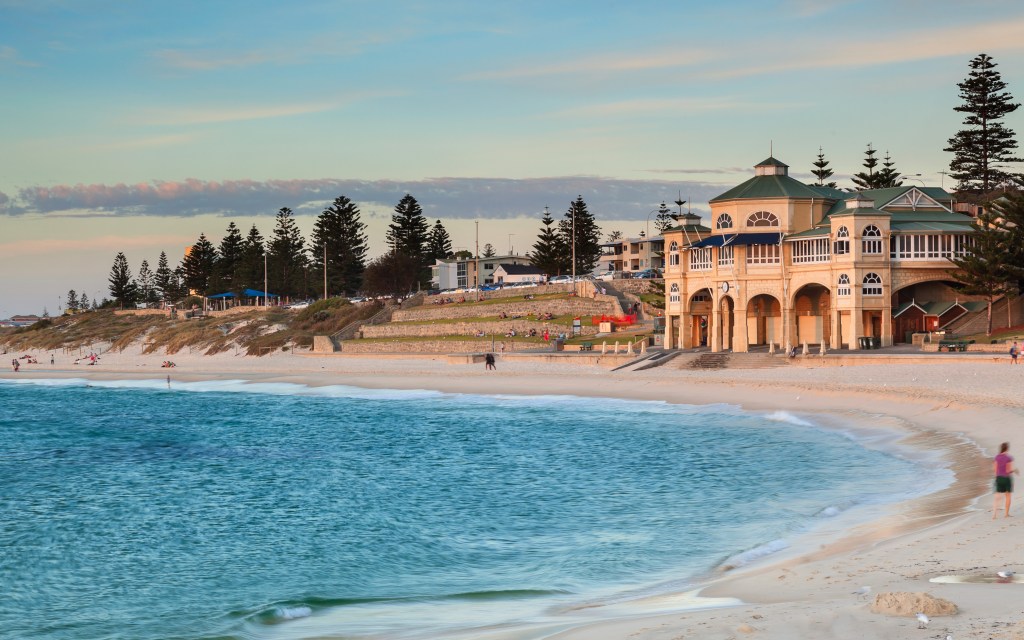
Sydney’s Eastern Suburbs jewel, Double Bay, leads with an average taxable income of $428,489, followed by Cottesloe on Perth’s coast at $365,588. NSW postcodes dominate the rankings, taking nine of the top 12 spots. The top 25 are all in NSW, Victoria, and Western Australia.
However, these same suburbs also carry some of the highest debt levels. (Map 2).
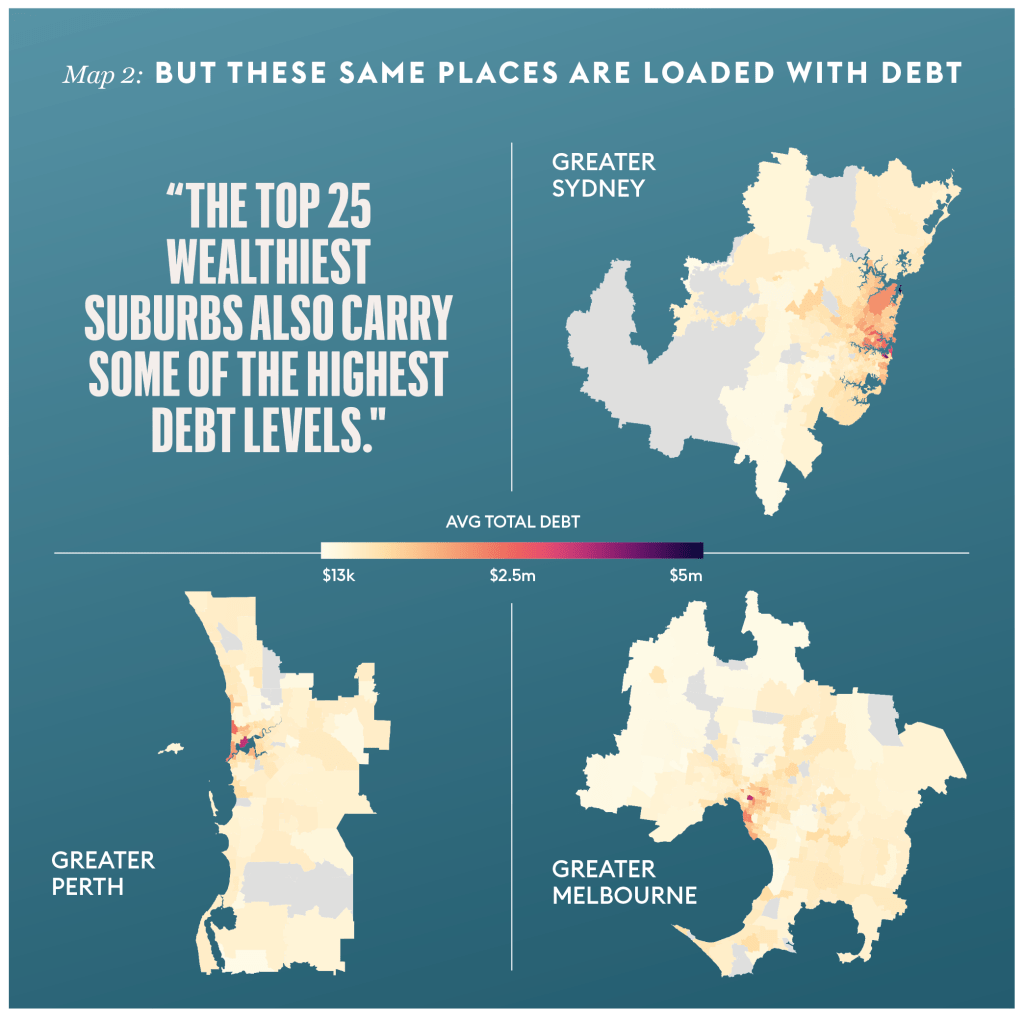
Digital Finance Analytics, which tracks household finances at a postcode level, found that the same high-income suburbs also carry burdensome mortgage, credit card, loan, and Buy Now Pay Later debt levels.
Sydney’s Palm Beach tops the list, with an average household debt of $5 million. It is followed by Bellevue Hill ($4.1 million) and Double Bay ($3.7 million) in Sydney’s east, then Toorak ($3.5 million) along Melbourne’s Yarra River. Again, NSW postcodes dominate – nine of the top 12 and the same three states occupy the top 25.
Top 25 postcodes by average taxable income
Postcode | Suburb | Avg. Taxable Income |
2028 | Double Bay, NSW | $428,489 |
6011 | Cottesloe, WA | $365,588 |
2027 | Darling Point, NSW | $335,382 |
3142 | Toorak, VIC | $330,934 |
2108 | Palm Beach, NSW | $303,709 |
2030 | Dover Heights, NSW | $298,660 |
2023 | Bellevue Hill, NSW | $297,195 |
3944 | Portsea, VIC | $290,543 |
2110 | Hunters Hill, NSW | $273,470 |
2063 | Northbridge, NSW | $273,148 |
2088 | Mosman, NSW | $266,050 |
2025 | Woollahra, NSW | $264,136 |
3916 | Shoreham, VIC | $237,905 |
6009 | Nedlands, WA | $232,918 |
6015 | City Beach, WA | $222,763 |
3206 | Albert Park, VIC | $221,980 |
3186 | Brighton, VIC | $220,094 |
3144 | Malvern, VIC | $219,214 |
2024 | Bronte, NSW | $214,978 |
3929 | Flinders, VIC | $214,764 |
3002 | East Melbourne, VIC | $210,901 |
2021 | Paddington, NSW | $210,591 |
2001 | Sydney, NSW | $208,407 |
2092 | Seaforth, NSW | $206,892 |
Top 25 postcodes by average household debt
Postcode | Suburb | Avg. Total Debt |
2108 | Palm Beach (NSW) | $5,006,500 |
2023 | Bellevue Hill (NSW) | $4,118,369 |
2028 | Double Bay (NSW) | $3,776,516 |
3142 | Toorak (VIC) | $3,454,400 |
6009 | Nedlands (WA) | $3,400,700 |
2063 | Northbridge (NSW) | $3,061,800 |
2027 | Darling Point (NSW) | $2,994,909 |
2030 | Dover Heights (NSW) | $2,970,750 |
2061 | Kirribilli (NSW) | $2,567,440 |
2069 | Roseville Chase (NSW) | $2,555,950 |
2088 | Mosman (NSW) | $2,456,030 |
6015 | City Beach (WA) | $2,446,190 |
6159 | North Fremantle (WA) | $2,259,666 |
2110 | Hunters Hill (NSW) | $2,236,963 |
2089 | Neutral Bay (NSW) | $2,225,857 |
3187 | Brighton East (VIC) | $2,177,377 |
2065 | Naremburn (NSW) | $2,138,900 |
3186 | Brighton (VIC) | $2,101,502 |
2066 | Lane Cove (NSW) | $2,074,506 |
2071 | Killara (NSW) | $2,068,384 |
3144 | Malvern (VIC) | $2,040,400 |
2062 | Cammeray (NSW) | $2,007,760 |
2104 | Bayview (NSW) | $1,997,300 |
2092 | Seaforth (NSW) | $1,992,630 |
2084 | Duffys Forest (NSW) | $1,967,360 |
Wealth vs. Debt
It comes as no surprise that high-income households carry high debt, but some suburbs balance it better than others. For example, Palm Beach residents may be in deep, but they also rank 6th in taxable income ($300k).
More interesting are the outliers – communities where wealth and debt are mismatched.
Cottesloe boasts the second-highest taxable income in the country but only ranks 29th in debt ($1.7 million) – an enviable balance.
But slightly further east in Nedlands, we find the reverse. The community has the 5th-highest debt levels in the country but is 14th in income.
Sydney’s Kirribilli and Roseville show the same trend, ranking 9th and 10th in debt but 25th and 35th in income, respectively.
Australians may be wealthy by global standards, but for many, it’s a balancing act.
More from Forbes Australia